Harnessing data analytics for effective Project Management
Infrastructure and social projects are generally large and
complex undertakings spread across multiple locations and sites that
combine a large number of activities having complex interdependencies
amongst them and performed by different vendors.
Success of these projects depends upon a variety of factors, not
least effective project management.
Effective project management requires collection
of field data from each implementation site and vendor, consolidation of this data
centrally and then converting the data into information that can help in
measuring, monitoring and managing progress and risks.
We can bring together clients and engineers; buyers, contractors and suppliers; project, quality and
risk managers faciltating data exchange to create shared data services,
breaking silos to track progress, identify potential issues, and proactively address
challenges in real-time.
Challenges
The client is implementing a major development project in about 200 locations. The project has
four major components with each component having several sub-components. Many activities
make a sub-component.
Volume and concurrent nature of activities
The sheer volume and concurrent nature of activities
make it extremely difficult to monitor and manage performance, risk, cost,
resource and quality
Change Management
The magnitude of the project is such that change is a
frequent need. Change, if not seamlessly introduced, can affect the entire
project lifecycle
Real-time reporting and dashboards
The project is implemented in hundreds of locations with
different stakeholders. Getting data from all the project locations, consolidating
and aggregating the data, and presenting a combined and hoslistic picture on
various parameters for day-to-day operations is quite complex and challenging.
Solution
Comprehensive & Real-time Digital Data
With our Appverse Platform, we put together a comprehensive
strategy to gather data digitally in real-time mode. All activities under
the various project components have been digitized enabling the field manpower
to enter data digitally either on mobile or web. Project managers / supervisors
can centrally view and approve the data.
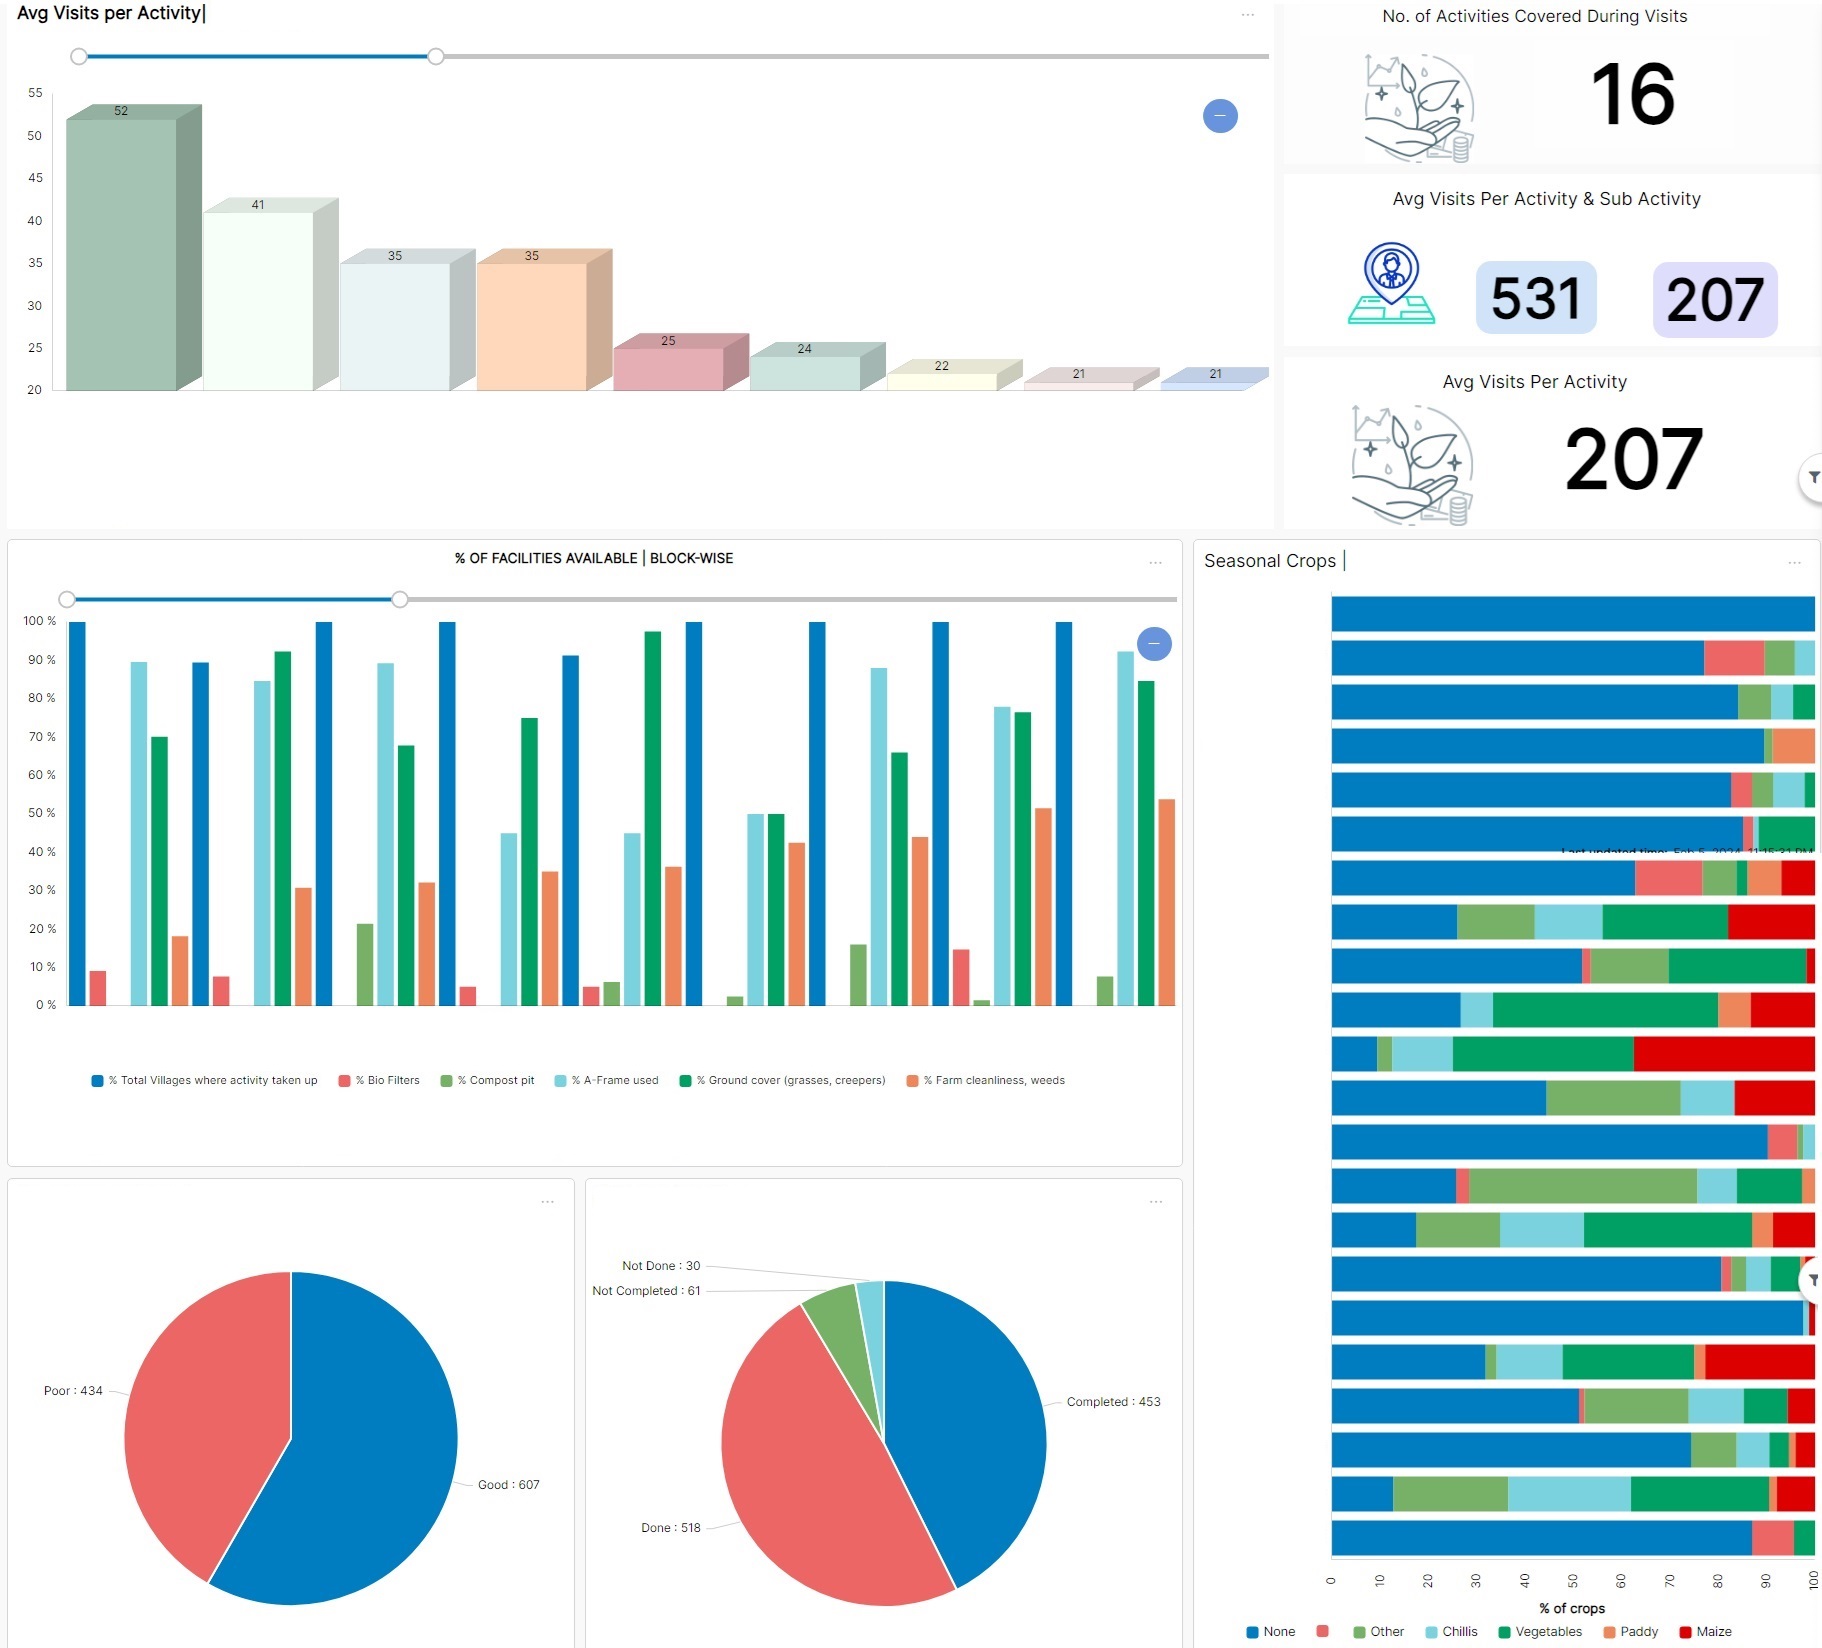
Real-time Dashboards
The data is processed, converted into meaningful metrics
and information. The entire process of deriving metrics and insights is automated
with rules and processing steps on ViewZen Analytics. Data analysts use this data to list facts and find
patters which are then presented on dashboards. Consolidated metrics from data
across activities and project locations gives a bird's eye view on the overall project.
Time-series analysis to look at trends, seasonality, moving averages etc. are
driving decision-making across project components
Agile Data Management
Both Appverse and ViewZen Analytics are agile and flexible
software platforms that support rapid configuration and deployment of digital
data collection tools and data analysis. Both these platforms allow
allow organizations to respond quickly to changes in business requirement
without requiring extensive coding or development efforts. These platforms provide
the backbone for agile data management in the project
Results
Real-time project activity and expenditure information, its
subsequent conversion into indicators and presentation on dashboards is
helping the client in many ways
Cost Variance
Cost variance points to the difference between the budgeted cost
and the actual cost in performing a work. A positive cost variance indicates that lesser
money was required to complete a work and a consistent positive cost variance can be used
to reduce budgets and allocate money for other productive activities. Similarly, a negative cost variance
can point to under budgeting or over expenditure
Schedule Variance
This indicates the difference between the planned Schedule
and the actual completion of an activity. Continuous real time data has helped
in getting a better visibility into the actual progress giving managers a
better control over schedule variances. A visibility into the progress of the
dependent activities is improving forward planning thereby reducing bottlenecks created by
dependent activities
Resource Utilization
Real-time visibility also helps in better planning and utilization of all
resources - manpower, material, equipments etc.
Vendor Performance
Real-time data helps to measure and track vendor performance,
compliance and delivery as well as monitor risks associated with individual vendors
and planning mitigation. Over time, lead-time data of
various vendors in performing various activities can help in ranking and
categorizing vendors.
About ViewZen Labs
Established in 2020 in Chennai, ViewZen Labs is a product-centric organization. Our product suite includes product for development of cross-platform applications, data integration, visualization, and artificial intelligence/machine learning (AI/ML). Our marketplace provides pre-built solutions to meet diverse business requirements across industries.